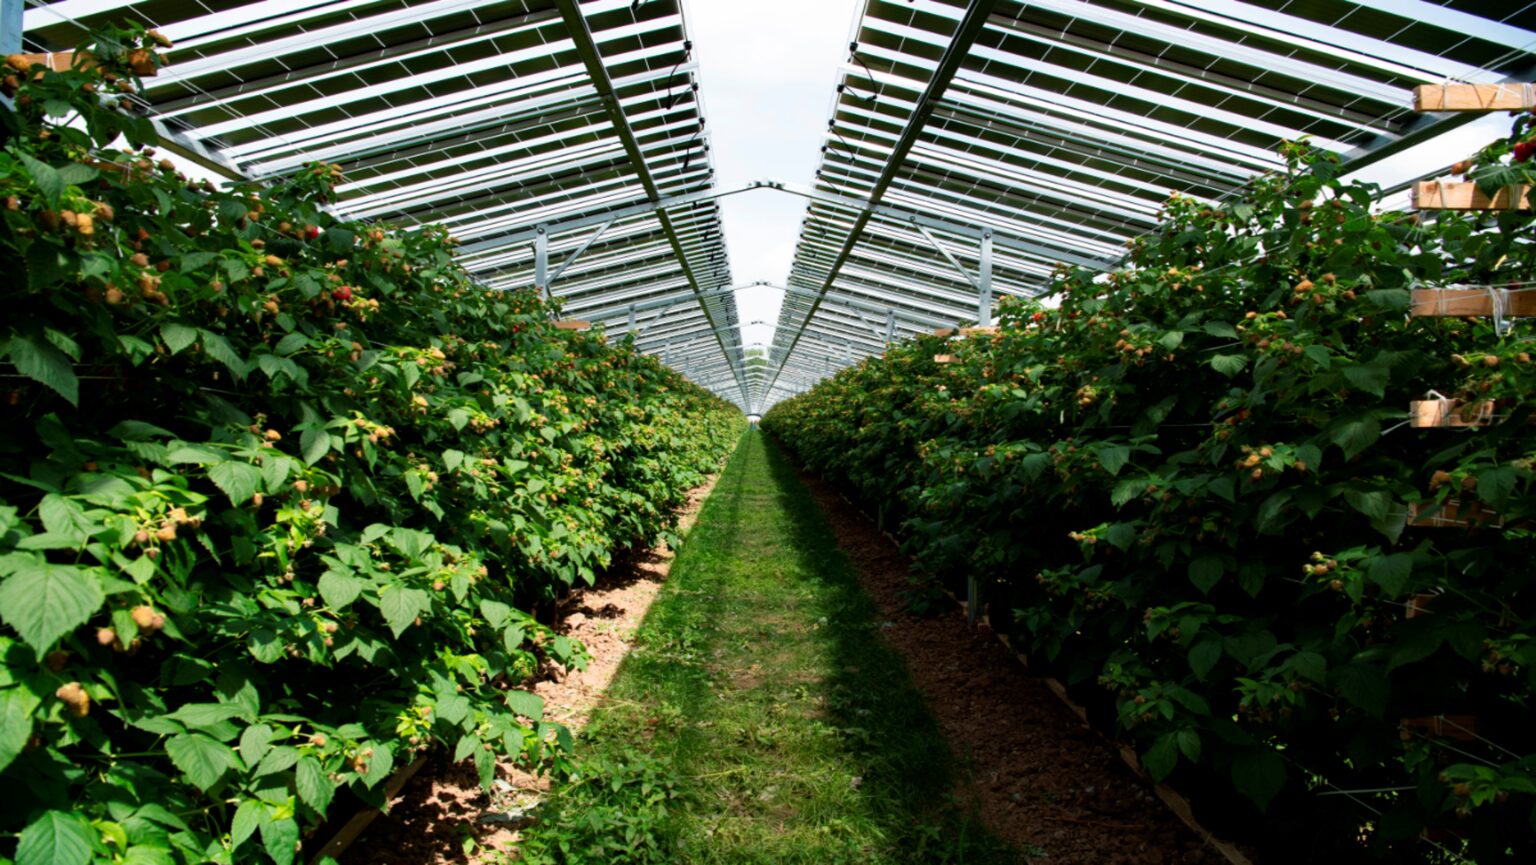
Why some projects get built and others do not, what breaks when you try to farm beneath the panels, and the many ways the world is learning to close the gap.
The final part of our agrivoltaics series. Part 1, The Sun, Twice Over, made the case for growing food and generating power on the same land. Part 2, Why It Isn't Built Yet, examined the barriers. This piece goes under the hood of the money.
Most conversations about clean energy stop at the moment a technology becomes cheap. Solar is now the least expensive source of new electricity in history, the argument goes, so everything after is a matter of will. That is true, and it is also misleading. Cheap electricity is not the same thing as a financeable project, and the gap between the two is where most good ideas quietly die.
A solar farm is not a solar panel. It is a 25-year financial instrument that happens to be made of glass and steel, and like any instrument it either clears the return its investors require or it does not get built. The panel can be nearly free and the project can still fail, because the panel is only one line in a much longer account that includes the price of land, the cost of borrowing, the creditworthiness of whoever buys the power, and the patience of whoever puts up the equity.
This piece is about the machinery that decides which projects clear. We start with how a utility-scale solar project actually works, in plain numbers, because the numbers are the argument. We walk through the real cost of building one, down to the price of a single watt. Then we change one thing, the cost of the structure that holds the panels off the ground, and watch the whole model break. That single change is what separates ordinary solar from agrivoltaics, the dual-use systems this series has spent two essays admiring, and it is why agrivoltaics is so hard to finance in exactly the places that need it most.
By the end we will have a full menu of the levers that can put a broken project back together, a way to compare them on one honest scale, and a tour of how different parts of the world are already pulling them. Some use a higher power price. Some use grants. Some use tax credits that, as we will see, can vanish with a single election. And one instrument, uniquely suited to the Global South, does something none of the others can. Carbon is not the only answer. It may be the most durable one.
Almost everything below reduces to three figures. Capex, the upfront cost to build the plant, quoted in dollars per watt. The PPA, the price a utility agrees to pay for the power, quoted in dollars per kilowatt-hour. And the cost of capital, the annual return lenders and investors require, quoted as a percentage. Revenue, cost, and the price of money. Hold those three and you can follow any project-finance argument ever made.
Strip away the engineering and every utility-scale solar project needs four things to exist. Miss any one and there is no project, only a slide deck. Because this is an essay about money, we will define each one in financial terms, not just plain-English ones.
Two terms carry the rest of the essay. The first is the difference between the project return and the equity return. The project, or unlevered, return measures what the whole plant earns on every dollar put in, ignoring how it was financed. The equity, or levered, return measures what the developer's own capital earns after the debt has been serviced. Because borrowed money costs less than the return equity demands, adding debt lifts the equity return, so long as the project out-earns its loans. This is leverage, and it is why the financing structure, not just the technology, decides whether a deal works.
The second is the cost of capital, and why it is so punishing in the Global South. A lender pricing an African power project is not just charging for the time value of money. It is charging for currency risk, because revenue in local currency services debt owed in dollars. It is charging for offtaker risk, the chance the state utility cannot pay. And it is charging a political-risk premium. Stack those and the numbers separate sharply. The International Energy Agency's Cost of Capital Observatory puts the weighted average cost of capital for utility-scale solar at roughly 8.5 to 9% in Kenya and Senegal, and 9.5 to 11% across South Africa and other emerging and developing economies, against 4.7 to 6.4% in North America and Europe.[5] Roughly double, for the same panels under a better sun. And the reason is not physical. In Africa the risk premium accounts for 60 to 90% of the cost of capital for a solar plant, against about 10% in advanced economies.[5] That gap, more than any difference in sunshine or hardware, is the largest reason a project that pencils in Spain fails in Zambia. Almost everything this article proposes is, at bottom, a way to bring that number down.
Take a 100 MW solar plant that costs $150 million to build and earns $13.5 million a year after operating costs. Financed entirely with the developer's own cash, that is a 9% unlevered return: $13.5M on $150M.
Now finance it the way real projects are financed. Borrow $105 million of the $150 million (70%) at 7% interest, and put in $45 million of equity. The interest bill is about $7.4 million, leaving roughly $6.1 million for the equity holder, who only invested $45 million. That is a 13.5% equity return, up from 9%, purely because the project out-earned its 7% loans.
The catch is symmetry. Borrow at 12%, above what this project earns, and the same leverage drags the equity return below 9%. This is why the cost of debt is not a footnote. In a high-rate market it is the difference between leverage that builds wealth and leverage that destroys it.
Solar capex is almost always quoted in dollars per watt, and the number is small enough to be deceptive. A dollar per watt sounds trivial until you multiply by 100 million of them.
Take a 100 MW plant, a mid-sized utility project. That is 100 million watts. At a round $1 per watt, it is $100 million of capital, spent almost entirely before the plant earns a cent. Move the price by a single dime, to $1.10 per watt, and the project cost moves by $10 million. This is why, in solar, the fight over pennies per watt is not pedantry. It is the difference between a financeable project and a dead one.
So what does a watt cost. The honest answer is that it depends heavily on where and when you build, and the 2025 picture is more interesting than a single number. The module itself, the part everyone pictures, has collapsed in price, from over $1.00 per watt in 2012 to under $0.25 per watt for utility-scale buyers in 2025.[3] And yet the finished-project cost has not fallen in step. In the United States, installed utility-scale costs actually rose about 8% in early 2025,[3] as tariffs and supply constraints pushed up everything that is not the panel. The cheap part got cheaper while the expensive parts, the steel, the labor, the wiring, the permitting, and the financing, did not.
Where does the money inside a watt go. The National Renewable Energy Laboratory models a benchmark utility system, 50 to 200 MW on single-axis trackers, and its Q1-2025 numbers hold a surprise.[3] The panels are no longer the biggest line item. The electrical balance of system, the wiring, transformers, and switchgear that connect an array to a transmission grid, is the single largest category at about $0.25 of a watt, just ahead of the modules at $0.24. Install labor comes next at roughly $0.20, the steel that holds the array up runs about $0.15, developer and EPC overheads about $0.12, off-site engineering about $0.07, and the inverter, the piece most people picture as the expensive electronics, is the smallest line on the list at roughly $0.03. Add them up and NREL's benchmark lands near $1.06 per watt, inside its published range of $0.98 to $1.10.[3]
That distribution is the whole argument in miniature. The component that collapsed in price is now about a fifth of the cost, while the things that did not fall, the copper, the steel, the labor, and the connection to the grid, are the rest of it. Hold that shape in mind, because agrivoltaics is about to distort it.
Before we go further, a piece of vocabulary that will recur, defined once and clearly. When analysts compare the cost of power from a solar plant against a gas or coal plant, they cannot just compare the build cost, because the plants last different lengths of time, run different hours, and burn different amounts of fuel. So they use the levelized cost of electricity, or LCOE. It takes everything a plant will ever cost, the capital, the financing, the fuel, the maintenance, across its whole life, and everything it will ever generate, and divides one by the other to get a single all-in price per unit of energy. It is the honest sticker price of a plant's power.
By that measure solar has simply won. Utility-scale solar came in around $0.043 per kilowatt-hour globally in 2024,[1] and $38 to $78 per megawatt-hour in the United States in Lazard's 2025 analysis, midpoint near $58.[4] For the tenth year running, solar and wind are the cheapest new-build power in Lazard's rankings. The technology has won its argument. The financing is the unfinished business, and LCOE hides the reason why: because a solar plant has almost no fuel cost, the overwhelming majority of its lifetime cost is the upfront capital and the interest on it. Change the cost of capital and you change the price of the power more than any engineering breakthrough could.
The instinct is that a poorer region with cheaper labor should build more cheaply. It does not, for structural reasons. Modules and inverters are globally traded and often cost more to land in an African port than in Rotterdam once freight, insurance, duties, and financing are counted. Order books are smaller, so developers lose the discounts that come with buying by the gigawatt. Permitting and grid studies take longer and cost more. And the developers themselves borrow at high rates to fund construction, which shows up in the installed cost. The result is a total installed cost roughly 40% above Europe's.[1] That is not a detail. It is a headwind baked into every project on the continent.
If African capex is high, the natural question is whether building enormous plants brings it down. Partly. But less than the industry's mythology suggests.
The dramatic economies of scale in solar are already behind us. They happened as the industry climbed from rooftops to fields, from kilowatts to megawatts. A residential system costs several dollars per watt, a utility system under a dollar and a half, and that gulf is real. But once you are already at utility scale, the curve flattens hard. Going from 20 MW to 100 MW to a full gigawatt lowers the cost per watt through bulk procurement, spread development costs, and repeated engineering, but only modestly. Berkeley Lab's data shows average project size growing several-fold over the past decade while cost per watt stayed on roughly the same gently declining path. Our modeling assumes about 13% lower cost per kilowatt across that entire span, from 20 MW to a gigawatt.[21] Meaningful, but not transformational.
If scale is a weak lever, siting is a strong one, and it is where a plant quietly makes or loses much of its money. Three things about a piece of land decide how much power, and therefore how much revenue, a given pile of panels will produce.
The lesson for a CFO is that a solar project's return is set as much by geography as by technology. Two identical plants, same panels and same price, can post returns points apart because one sits on a sunny site beside a substation and the other does not. Keep both facts in mind, the flatness of the scale curve and the power of siting, because together they mean you cannot build your way out of a cost problem. If a design is expensive per watt, making it gigantic helps only at the margin, and no site, however sunny, fully rescues economics broken at the level of the structure itself. Which is exactly what agrivoltaics does.
Everything to this point is ordinary utility-scale solar. Now we change a single input.
Agrivoltaics, as Part 1 described, raises or rearranges the panels so agriculture can continue between and beneath them. There are four broad ways to do it, and they are not financially equal. Interspace spreads ordinary ground-mounted rows farther apart to leave room for crops or grazing, and costs almost the same as a conventional plant. Vertical systems stand bifacial panels on end in east-west walls, somewhat more expensive for the special modules and mounts. Overhead or elevated systems raise the panels 3 to 4 meters into the air on a steel structure so machinery and taller crops can operate underneath. Solar greenhouses build the panels into the growing structure itself.
The Fraunhofer Institute and Germany's Technology and Support Centre have costed these directly, and the pattern is stark. The premium is not in the panels. It is in the steel. Raising an array high enough for a tractor to pass under it means deep foundations, tall mounting structures, and often semi-transparent modules designed to let light reach the crop, and that single choice roughly doubles the capital cost and raises the levelized cost of its electricity by about 88%.[6]
Fraunhofer's cost study, taken as multiples of a conventional ground-mounted plant:[6]
| Ground-mount (the baseline) | 1.00x |
| Interspace | ~1.07x |
| Vertical bifacial | ~1.20x |
| Overhead / elevated | ~2.16x |
| Solar greenhouse | ~3.0x (est.) |
Read the elevated line again. To farm meaningfully beneath the panels, you pay roughly 2.16 times the cost of a normal solar plant. That multiple is the single most important number in this essay, and everything after it is a search for who pays the difference.
The design that best serves the farmer is the most expensive way to build solar. The best agriculture sits on top of the worst economics.
Here is the cruel geometry at the center of the subject. The cheapest agrivoltaic designs, interspace and vertical, interfere least usefully with real farming. Vertical walls leave the land open but shade it in moving bands and give a tractor little room. Interspace is barely more than a conventional plant with gaps. The design that actually delivers the dream of Part 1, a field where a farmer drives a combine under a canopy of panels while the crop grows in dappled shade, is the elevated system, and it is the single most expensive way to build solar. So from here we do the hard case. We model the elevated system, because if the numbers can be made to work for it, they can be made to work for anything lighter.
To see what that premium does, we built a full project-finance model of a 200 MW elevated agrivoltaic plant in three representative Article 6 carbon markets, Zambia, Ghana, and Nigeria. We use each country's real, published figures, and treat the results as illustrations of the mechanism, not project proposals. The point is not the precise decimal. It is the shape.
Each country contributes public data. For the carbon math we use each grid's emission factor, the carbon dioxide displaced per unit of solar energy. Zambia's national figure, from the government's Grid Emission Factor Report of March 2025, is 0.4029 tonnes per megawatt-hour.[7] Ghana's and Nigeria's, from the harmonized dataset used by the development banks, are 0.509 and 0.477.[8] For the hurdle rate we use the country-specific benchmarks from the standard carbon-market investment guidance: near 13.25% for Zambia and Ghana, 13.0% for Nigeria.[9]
Now the part that matters, how the money is actually structured. At an elevated cost of roughly $1,790 per kilowatt, a 200 MW plant costs about $357 million to build. We do not simply assume a debt ratio. We size the debt the way a lender does, to a coverage test: each year's operating cash flow must exceed that year's loan payment by a safe margin, conventionally about 1.3 times, a ratio lenders call the debt-service coverage ratio. At a de-risked interest rate of 7.5% over a 15-year term, that test supports roughly 45 to 50% debt, around $165 million, leaving the developer to fund the other $180 million or so in equity. That equity wants its roughly 13% return. Here is what it actually earns.
| 200 MW elevated · ~$357M capex | Equity IRR | Hurdle | Gap |
|---|---|---|---|
| Zambia | 4.5% | 13.25% | ~8.7 pts |
| Ghana | 4.8% | 13.25% | ~8.5 pts |
| Nigeria | 6.1% | 13.0% | ~6.9 pts |
Seven to nine points short. The project produces clean power, displaces real carbon, feeds a community, and still does not clear the bar its own equity requires. And here is the finding that reframes everything: carbon revenue at $35 per tonne[13] contributes only about 1 to 1.5 points of that return.[21] The thing everyone points to as the answer, selling carbon credits, barely moves the needle at today's price. That does not mean carbon is the wrong answer. It means we have been thinking about it the wrong way.
Every return figure here comes from a transparent financial model built for this series, using the public inputs described and standard project-finance methods. The assumptions, on capex, power price, yield, financing, and carbon, are documented and directional. They are meant to reveal how the levers behave, not to price a specific transaction. The two most sensitive inputs are the capital cost and the power price, and both are set on the favorable side, so the real gap is if anything wider than shown.
A project sitting seven points below its hurdle can only be rescued by moving one of a finite set of numbers. The public conversation fixates on carbon and ignores the rest, so let us do the opposite and lay the whole board out. There are four families of lever, and every real-world subsidy, tariff, guarantee, or carbon contract is one of them in a costume.
The problem with a list like that is that the items are in different units, and you cannot manage what you cannot compare. How do you weigh a cent on the tariff against a point of interest against a 20% grant? So we built a common yardstick, and it is the most useful thing in this essay.
The method is simple. Take the model, nudge one lever by a realistic amount, and measure how many points it adds to the equity return. Then ask a single question: what price of carbon would have produced the same lift? That converts every lever, however different in kind, into one currency, dollars per tonne of carbon. A tariff increase, a cheaper loan, a tax holiday, and a grant can now be laid side by side on a single axis and ranked.
Read that chart the way a CFO would, and two conclusions land hard.
The first is a single sentence that should change how anyone in this industry argues. One cent per kilowatt-hour on the power price is worth about $31 per tonne of carbon.[21] A slightly higher tariff does the exact same work as a much-discussed carbon contract. They are two faces of one coin. And that has a blunt corollary for the Global South: every cent a government shaves off the solar tariff to keep power affordable, an entirely worthy goal, is roughly $31 per tonne of carbon that someone else must now supply to make the same project bankable. Cheap power and carbon finance are not separate conversations. They are the same conversation, measured in different units.
The second is that no single realistic lever closes a seven-point gap. Only an extreme move does it alone: a carbon price of $120 to $156, or a capex cut deep enough to be fictional, or an outright grant covering a third of the project.[21] Notice, too, what sits at the bottom of the chart. Lengthening the loan tenor or the crediting period, the levers people reach for first because they sound free, are worth almost nothing. The value is concentrated at the top, in the capital cost, the two prices, and blended-finance support.
Developers and lenders do not only size debt to the coverage test. They negotiate to an equity check, often 20 to 60% of project cost, and build the deal around it. That split is itself a lever. Pushing more debt in lifts the equity return, because borrowed money is cheaper than the return equity wants, but it thins the coverage cushion until lenders balk. Our model lets you set the equity share directly: at a 40% equity check on this elevated project, returns improve, but the coverage ratio falls toward 1.1x,[21] the level where a credit committee starts asking hard questions. There is no free leverage. There is only the point where the lender says no.
Here is the part the carbon conversation usually skips. Agrivoltaics is already being built, at scale, across Europe and East Asia, and almost none of it is financed with carbon. The wealthy world closes the very gap we have been describing with a menu of ordinary levers. Seeing them in action proves the gap is closeable, and shows exactly which tools the Global South is missing.
That last one deserves its own paragraph. The 2025 budget law is sunsetting the commercial solar tax credit, requiring construction to begin by mid-2026 and projects to be in service by the end of 2027, and it added new restrictions on component sourcing. The rural grant program was paused in March 2026, with the agriculture department explicitly moving to discourage solar on productive farmland.[18][19] In the span of a single year, the two levers that made American agrivoltaics work were pulled at once.
A subsidy is only as durable as the next election. A contract is a contract.
That reversal exposes the weakness at the heart of the subsidy toolkit. Tariff premiums, grants, and tax credits are real and powerful, and where they exist, agrivoltaics gets built. But they are political creatures. They can be legislated away as fast as they were legislated in, and a developer who financed a 25-year asset on the strength of a 5-year policy has taken a risk that has nothing to do with the sun. The Global South cannot out-subsidize the wealthy world, and after watching the largest economy on earth gut its own program in a year, it should not want to depend on subsidies an election can erase.
If the subsidy toolkit is powerful but fragile, and the Global South has less of it to begin with, the question becomes what durable, bankable lever these markets actually possess. The answer is an authorized carbon contract under Article 6 of the Paris Agreement. Not because it is the biggest number on the yardstick. At today's price it is not. Because it is the most durable, and it does something none of the other levers can.
Agrivoltaics can earn carbon in two distinct ways, and they stack. The first is the grid-offset credit: clean solar displaces fossil generation, and the tonnes avoided, from that national emission factor, become credits, earning for about 15 years under the Paris rules.[12] The second is the soil-carbon credit from the farming underneath, quantified under Verra's improved agricultural land management methodology, which credits for 20 years or more and was among the first agricultural methods approved under the market's highest integrity standard.[11] Two revenue streams from one hectare, one from the sky and one from the ground.
Now the reason carbon is different here, which has nothing to do with its price per tonne. An authorized Article 6 offtake is not merely revenue. It is a hard-currency, multi-year, sovereign-backed contract. That is precisely the ingredient a frontier-market project most lacks, and precisely the ingredient that compresses the cost of capital and unlocks the other levers. A project with a creditworthy carbon contract in dollars can borrow more cheaply, because the lender sees a revenue line it trusts. It can attract the grants and guarantees blended finance exists to provide, because those institutions are hunting for exactly this kind of anchor. The carbon contract does not just add a revenue stream. It changes the risk profile of the whole project, and in doing so it pulls every other lever within reach.
Which brings us to the hardest number in this article. If scale cannot save the elevated system, and carbon at $35 cannot either, how much of either would it take? We modeled the extreme. Build not 200 MW but a full gigawatt, capturing every economy of scale available, and the carbon price needed to reach the hurdle falls only to somewhere between $91 and $126 per tonne.[21] A gigawatt, and still three to four times today's price. To make the same project bankable at $35 purely by cutting cost, capex would have to fall to roughly $1,140 to $1,290 per kilowatt, only about 1.2 to 1.36 times an ordinary ground-mounted plant.[21] But an elevated structure, by physics, costs about 2.16 times ground-mount. You cannot cut the cost of an elevated system below the cost of the steel that makes it elevated. Scale runs into a floor it cannot pass.
| Breakeven carbon price | 20 MW | 200 MW | 1 GW |
|---|---|---|---|
| Zambia | $206 | $156 | $126 |
| Ghana | $177 | $133 | $106 |
| Nigeria | $164 | $119 | $91 |
A carbon credit is only legitimate if the project would not have happened anyway. Verra's additionality tools, active since October 2024, test exactly that by way of the investment analysis this article has been running.[10] In much of the world, grid-connected solar is now so profitable on its own that claiming carbon credit for it fails this additionality test, and rightly so. The Global South is the exception that proves the rule. Here, as this whole article shows, the projects genuinely do not clear their hurdle without help, which is exactly what additionality requires. The nuance is the grid factor itself: Zambia's grid is heavily hydroelectric, so in a normal year its solar displaces relatively clean power, which would weaken the carbon case, except that recent drought has pushed the grid toward diesel and imports and raised the real emission factor, which the 2025 national study now reflects. The additionality that is a problem elsewhere is, in these markets, simply the truth.
So we return to where the levers left us, with a project seven points short and no single instrument able to close it. The mistake would be to read that as defeat. It is the opposite. It means there are many roads in, and several of them work. Here they are, each a way to bring the same 200 MW elevated project to its hurdle.
| Carbon $50 + PPA +1c + 15% grant + tax holiday | Equity IRR | Hurdle |
|---|---|---|
| Zambia | 15.3% | 13.25% |
| Ghana | 15.2% | 13.25% |
| Nigeria | 19.3% | 13.0% |
Read that table slowly, because the shorthand hides how ordinary each ingredient is. Carbon at $50 a tonne means an authorized Article 6 offtake priced modestly above today's roughly $35, and far below the $120-plus the carbon would need if it were carrying the project by itself. PPA +1c means one additional cent per kilowatt-hour on the power price, taking a 7-cent tariff to 8 cents, a fraction of the premium Germany already pays its agrivoltaic projects. A 15% grant means development finance covering fifteen cents of every dollar of construction cost, less than half of what Italy already hands out and under a third of what American rural grants reached. And a tax holiday means the corporate tax rate set to zero for the project, an incentive most African solar regimes already offer as a matter of course. Not one of those four, on its own, closes a seven-point gap. Stacked together, they lift all three projects to equity returns between 15 and 19%, comfortably past the hurdle.[21] The gap was never a canyon. It simply cannot be crossed in a single stride.
If the answer is a stack, then the work is assembling one, and that work has named owners. This is not a call for goodwill. It is a short list of concrete, assignable actions, each of which moves a real lever in the model above.
The Global South is where all of this can align, because it is the one place where the additionality is real, the need is urgent, and the sovereign carbon contract is both available and transformative. That is not a coincidence. It is the argument.
We began with a distinction that is easy to miss. Cheap electricity is not a financeable project. Solar has won the contest of cost, decisively and for a decade running, and yet whether any particular field of panels gets built still turns on the same four ingredients and the same handful of levers it always has. A bankable offtake, a place on the grid, capital at a price, and a return that clears the hurdle.
Agrivoltaics changes one input, the cost of lifting the panels high enough to farm beneath them, and that single change is enough to push the best version of the idea below the line. Nothing about the technology is broken. The panels work, the crops grow, and the two together use land better than either alone. What is missing is not innovation. It is financial assembly, and the keystone of that assembly, in the markets that need it most, is a carbon contract that does far more than sell tonnes. It makes every other lever reachable, and unlike the subsidies that just collapsed in the world's largest economy, it does not expire with an administration.
The physics of solar is settled. The financial physics is not, and that is where the next decade of this work will be won or lost. The good news, buried in all these numbers, is that the gap is not a canyon. It is a set of levers, each one understood, each one available, waiting to be pulled together in the one part of the world where the math, at last, can close.
21 references · figures labeled where derived or illustrative
Vera Meridian
Staring at the same gap on a project, or want to talk through what it would take to close it?
Get in touch →